Want to optimise your solar energy system? Smart monitoring apps let you track your solar panels, battery, and grid usage in real time. From detecting issues like shading or dirt to reducing energy bills, these apps provide live updates and tools to help you make better energy decisions.
Key Features:
- Live Power Tracking: See second-by-second energy flows between your panels, battery, home, and the grid.
- Cost Savings: Use surplus solar energy or off-peak grid power to run appliances or charge batteries.
- Alerts: Instant notifications for system faults or performance issues.
- Energy Profiles: Modes like ‘Self-Consumption’ or ‘Savings’ let you prioritise solar use or time-of-use tariffs.
- Historical Data: Analyse daily, monthly, and yearly trends to improve efficiency or decide when to expand your system.
Why It Matters:
In Northern Ireland, where weather is unpredictable, monitoring ensures your system works efficiently. Households save around £140 annually for every £1,000 spent on solar, provided systems are maintained. Apps also help you align energy use with solar production, reducing grid dependence and maximising savings.
Setup Essentials:
- A compatible inverter or gateway (e.g., Enphase IQ Gateway, SolarEdge).
- Stable internet (Wi-Fi or Ethernet preferred).
- A smartphone or tablet to install the app.
With features like live updates, energy profiles, and fault alerts, these apps simplify solar management, helping you save money and reduce grid reliance.
Setting Up Your Solar Monitoring App
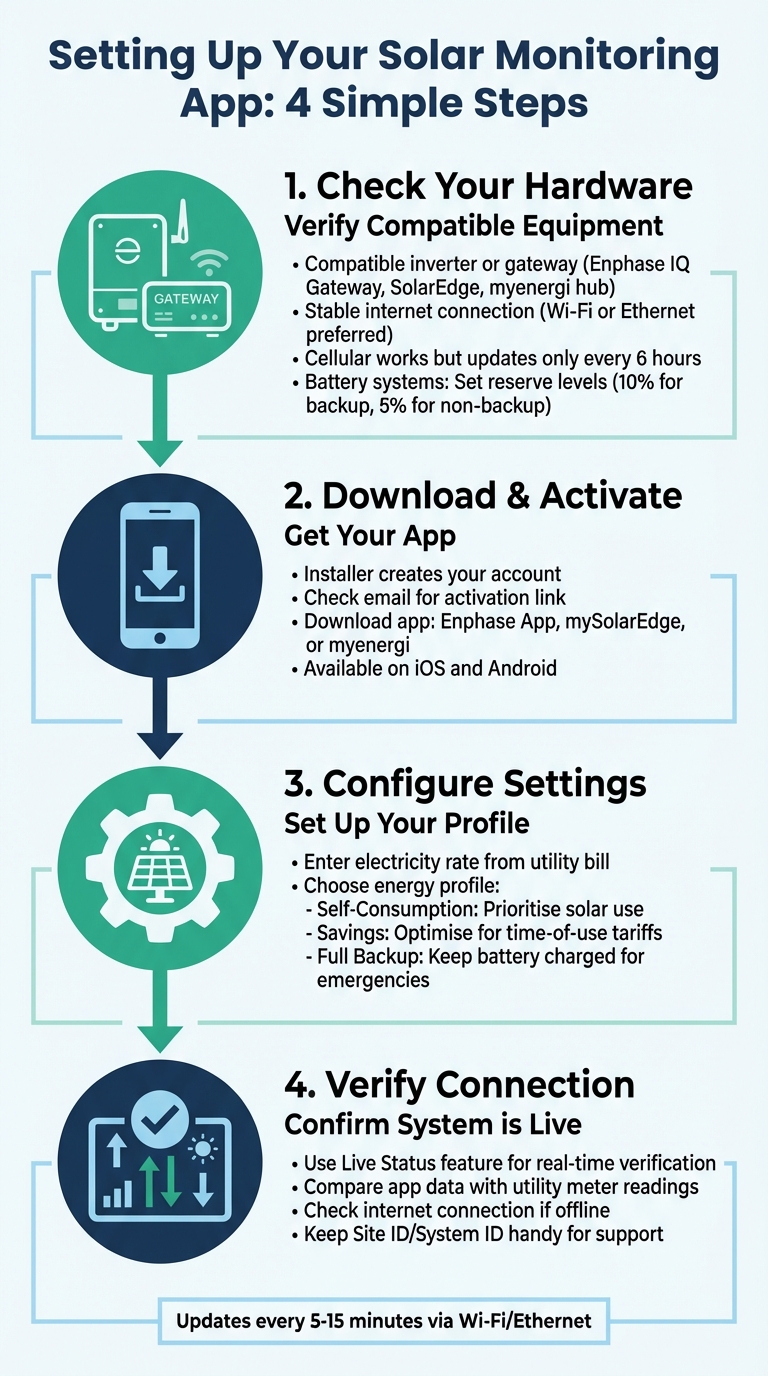
Solar Monitoring App Setup Guide: 4 Steps to Track Your Energy Production
Getting your solar monitoring app up and running is straightforward, but you’ll need a few essentials to get started. First, your EECO Energy system must have a compatible inverter or gateway, such as an Enphase IQ Gateway, SolarEdge inverter, or myenergi hub. These devices transmit data from your solar panels to the internet. A stable internet connection – via Wi‑Fi or Ethernet – is ideal for faster updates, though cellular connections can work (albeit with slower updates). Lastly, you’ll need a smartphone or tablet running iOS or Android to install and use the app. If you’ve added battery storage systems like Dyness, Soluna, or Duracell, or smart devices like the zappi EV charger or eddi power diverter, these will seamlessly integrate into the same dashboard.
What You Need for Solar Monitoring
Before you download the app, make sure your hardware is ready to go. Your inverter or gateway acts as the system’s communication hub, sending performance data to the cloud. For real-time tracking, Wi‑Fi or Ethernet is the best choice, as cellular connections only update every six hours. If you’re using battery storage, systems like Enphase let you set a minimum reserve level – 10% for backup systems and 5% for non-backup setups. You’ll also need a mobile device with internet access and enough storage space to download the app from the App Store or Google Play.
How to Set Up Your App
For most systems, including Enphase and SolarEdge, your installer will handle the initial account setup. Once your account is created, you’ll receive an activation email. Follow the link in the email to set up your login credentials, then download the relevant app – such as the Enphase App, mySolarEdge, or myenergi app. Once logged in, enter your current electricity rate from your latest utility bill in the app’s settings. This allows the app to calculate your savings accurately. You’ll also need to choose an energy profile:
- Self-Consumption prioritises using your solar power directly.
- Savings optimises for time-of-use tariffs.
- Full Backup ensures your battery remains charged for emergencies.
After setting this up, use the Live Status feature to confirm that data is flowing correctly from your system.
Checking Your System Reports Correctly
Once the setup is complete, the "Live Status" feature becomes your go-to tool for verifying that everything’s running smoothly. This feature provides real-time updates on power flows between your panels, battery, home, and the grid, ensuring all hardware is connected. To double-check accuracy, compare the daily generation figures shown in the app with your utility meter readings. If the numbers don’t match or the app indicates your system is offline, start by checking your home internet connection. Then, make sure your inverter or gateway is powered on. Keep your Site ID or System ID handy in case you need to contact support.
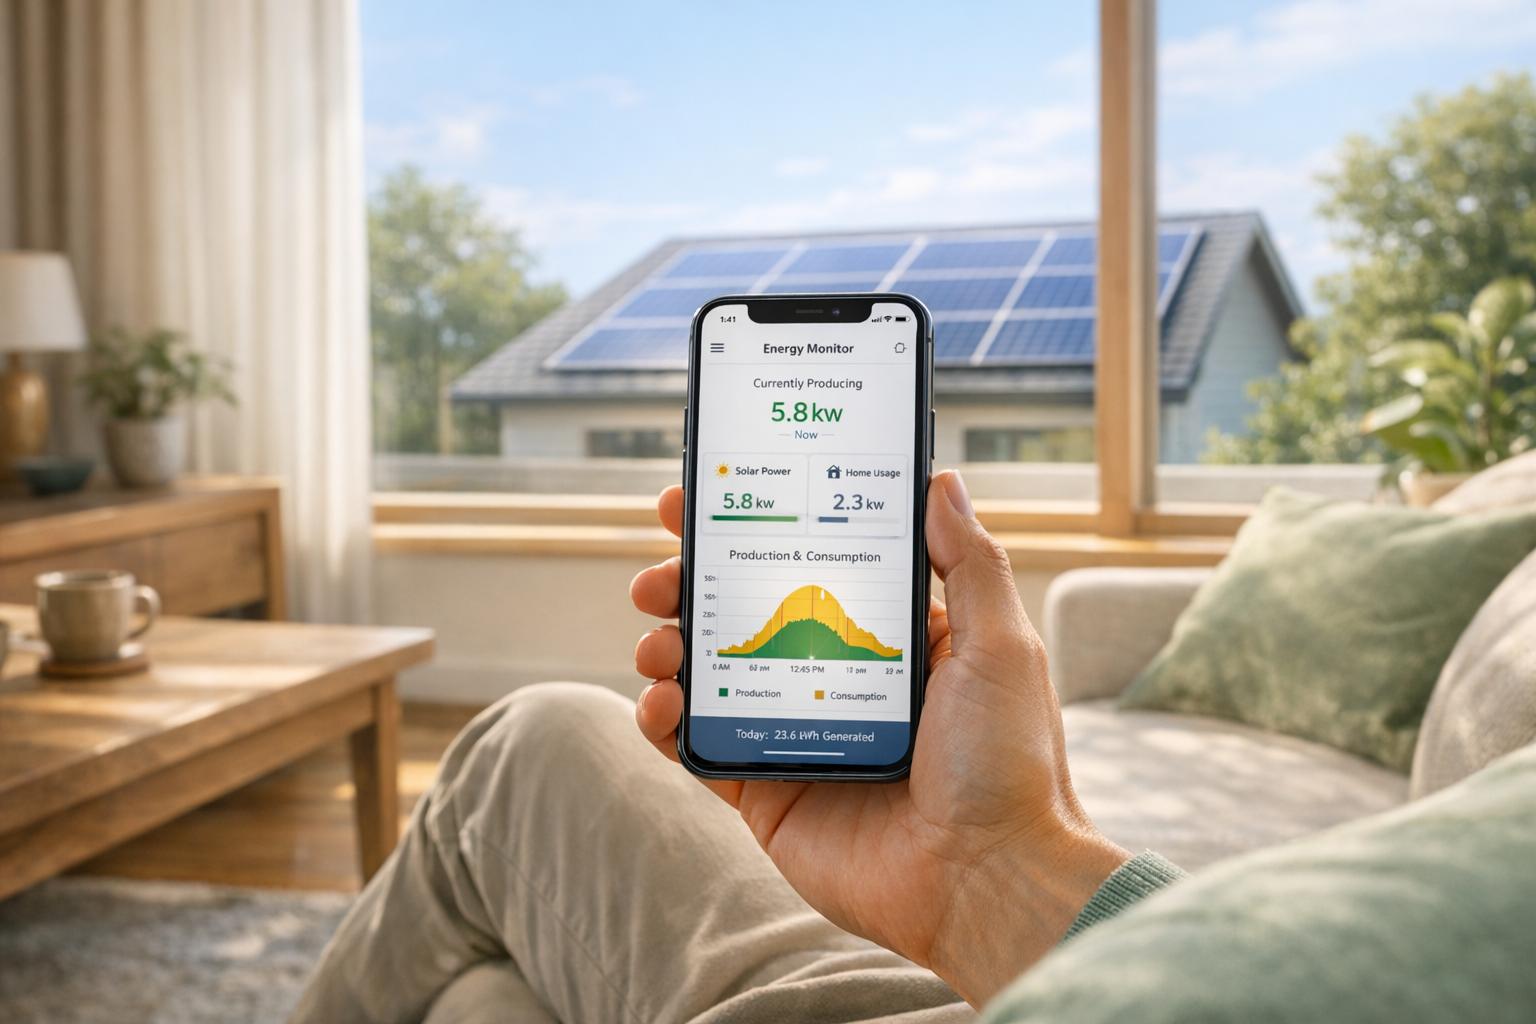
Reading Real-Time Data from Your Solar System
Once your app is up and running, you’ll start seeing live updates that detail how electricity flows through your solar system. This real-time information is incredibly handy for figuring out the best times to use your appliances and balancing your reliance on the grid versus your solar power.
Main Metrics Your App Shows
Let’s break down the key metrics your monitoring app provides for real-time insights. Two primary measurements stand out: Power (kW), which shows the rate of electricity generation at any given moment, and Energy (kWh), which tracks the total electricity generated or consumed over time. For example, the Live Generation feature displays your system’s current output, while Daily Production accumulates the energy generated throughout the day. You can also monitor Consumption, Grid Import/Export, and the State of Charge (SoC) for any connected battery storage.
Most apps refresh data every 5–15 minutes via Wi-Fi or Ethernet. However, the Live Status feature can provide second-by-second updates, which is especially useful when high-demand appliances are in use. Additionally, Power Flow Illustrations use arrows to visually show energy moving between your solar panels, home, batteries, and the grid. Metrics like Grid Dependence – lower values indicate a higher reliance on your solar power – and Solar Offset, which measures the percentage of energy needs met by solar, are particularly useful. If you’re using an Enphase or SolarEdge inverter, the Array view feature lets you monitor individual panel performance, helping you spot issues like shading, dirt, or hardware faults quickly.
Adjusting Your Energy Use Based on Live Data
Real-time data makes it easier to align your energy use with solar production. Use your app to identify peak production times – usually around midday – and schedule energy-intensive tasks like laundry, dishwashing, or charging an electric vehicle during these hours to minimise grid usage. The Live Status feature can help you confirm that your solar system or battery is ready to handle the increased demand without pulling expensive electricity from the grid.
Your app’s energy profile settings are also crucial. Choose Self-Consumption mode to maximise the use of your solar power, or select Savings mode if you’re on a time-of-use tariff. This mode encourages your battery to discharge when electricity rates are at their highest. If you have a zappi EV charger, you can set it to smart charge during midday solar peaks, ensuring your car runs on renewable energy. For those on a time-of-use plan, the app allows you to schedule up to six daily time slots to charge your battery from the grid during cheaper off-peak hours overnight.
Matching App Data to Your EECO Energy System
Your app’s real-time insights can also help ensure that your EECO Energy system’s performance aligns with its specifications. For instance, a 4.5 kW system with 10 panels will naturally produce different peak figures compared to a 9 kW system with 20 panels, so your results will vary. Metrics like Solar Offset and Energy Independence should reflect the expected output based on the size of your panel array and battery capacity.
To verify the accuracy of your system, compare your app’s daily generation data with your utility meter readings. If discrepancies arise or your app shows the system is offline, start by checking your home internet connection and ensuring your inverter or gateway is functioning. After storms or during high-pollen seasons, use the Array tab to check if any panels are underperforming due to debris or damage. Keep in mind that data typically updates every 5–15 minutes via Wi-Fi or Ethernet, or up to 6 hours if using a cellular connection.
Using Past Data to Cut Your Energy Costs
Your monitoring app doesn’t just track your solar system’s performance in real time – it also stores historical data. This data can be a game-changer when it comes to reducing energy costs. It helps you identify patterns, like when you might be wasting solar power, relying too much on the grid, or even if your system isn’t meeting your household’s needs. By reviewing this history, you can dive into detailed charts that break down your energy usage and production on daily, monthly, and yearly levels.
Reading Daily, Monthly, and Yearly Charts
Daily charts give you a close-up view of how your energy is being used hour by hour. For example, your solar panels likely generate the most electricity between 11 am and 3 pm, while your household consumption often peaks from 4 pm to 8 pm. Monthly reports, on the other hand, reveal seasonal variations. The Solar Offset metric shows how much of your energy demand is met by your solar system. In Northern Ireland, for instance, summer months typically produce far more energy than the darker winter months. You can even customise date ranges to match your electricity billing cycle, which makes it easier to check if the app’s "Monetary Impact" figures line up with your actual savings. Yearly charts provide the big picture, tracking metrics like Energy Independence and Grid Dependence. These help you measure how self-reliant your household is over time.
Optimising Energy Use
Once you’ve analysed the charts, you can use this knowledge to time your energy usage more efficiently. If your daily charts show strong solar generation between 11 am and 3 pm, consider scheduling energy-intensive tasks – like running the washing machine or charging your EV – during those hours. This reduces your reliance on the grid and cuts costs. The same goes for dishwashers and tumble dryers. Most apps allow you to prioritise solar power with a ‘Self-Consumption’ mode or maximise savings with an off-peak battery discharge setting. If you’ve got a PV diverter, your historical data might show that excess solar energy could cover nearly all your hot water needs during summer. To take it a step further, avoid running multiple high-energy appliances at the same time. Or, if you have a Home Energy Management System (HEMS), it can automatically activate appliances when solar production hits a certain level.
Deciding When to Expand Your System
Historical data doesn’t just help you save – it can also guide you when it’s time to upgrade your system. For instance, if your yearly charts show high Grid Export during the day but high Grid Import at night, it might mean you’re generating more energy than you can use. In this case, adding a battery could be a smart move. Options like a 10 kWh Dyness (£2,400), Soluna (£3,000), or Duracell (£3,650) can store that extra energy for evening use. On the other hand, if your Solar Offset consistently stays below 50%, it could mean your system is too small for your household’s needs. Check the Array tab for underperforming panels or monitor battery performance during simulated outages – both can help you decide if an upgrade is necessary.
Before rushing into an expansion, though, it’s worth exploring simpler fixes. Cleaning your panels or trimming nearby trees might improve performance without the need for costly upgrades. And if you do decide to expand, entering your specific cost per kWh into your app settings can generate a precise "Monetary Impact" report. This will help you calculate the payback period for your investment. On average, households in Northern Ireland save about £120 per year for every £1,000 spent on solar. That’s a solid figure to keep in mind when weighing your options.
sbb-itb-d2d975a
Setting Up Alerts and Keeping Your System Running
A monitoring app is only as good as its ability to alert you to system issues when they arise. Many solar monitoring apps require you to manually enable push notifications in the "Account" or "Settings" section to ensure you receive immediate updates about potential problems. Without enabling these notifications, you might miss critical warnings until you actively check the app. Once notifications are set up, your phone will alert you right away if there’s an inverter error, a panel fault, or a system outage. Most apps also feature a "Notices" or "Fault Alarm" section where specific warnings and performance issues are logged for later review. These alerts work hand-in-hand with your live data, providing a more detailed understanding of your system’s performance.
Creating Alerts for System Problems
Make sure to set up notifications for key issues such as inverter errors, component faults, and safety concerns. These alerts are active around the clock and can help you address problems before they escalate. Some platforms even let you schedule notifications to avoid disruptions during off-hours. After severe weather or during seasons with heavy pollen, it’s a good idea to check the "Array" or "Panel-level" view in your app. This can help you identify underperforming panels that might be affected by debris or shading. Advanced apps often include an "Event History" feature, allowing you to review when outages occurred and how your system handled them.
Adjusting Alerts for Northern Ireland Weather
To make alerts more relevant, customise them to reflect local conditions. In Northern Ireland, frequent cloud cover can make it difficult to tell the difference between normal low production and a genuine system fault. Advanced monitoring tools use algorithms to compare your system’s output against expected levels based on local weather patterns. This helps minimise false alarms during prolonged periods of low light. Some systems also feature weather-responsive capabilities, automatically adjusting battery charging to ensure optimal backup readiness. If you notice performance dips on typically overcast days, consider tweaking your alert thresholds to better align with the region’s climate.
Regular Checks to Keep Data Accurate
Even with alerts in place, it’s essential to perform routine checks to ensure your data remains accurate. Connectivity plays a big role here – systems connected via Wi-Fi or Ethernet typically update every 5 to 15 minutes, while those using cellular connections may only update every 6 hours. If you change your home network, use the app’s built-in guides to update your Wi-Fi credentials and avoid data gaps. It’s also a good habit to cross-check the app’s energy data with your utility bill from time to time. For systems with batteries, verify that your charging and discharging schedules align with your current time-of-use tariff. Lastly, if your app offers a "Grid Control" feature, use it to simulate an outage. This will help confirm that your backup systems and alerts are functioning as they should.
Getting the Most from Your Solar Monitoring App
Your solar monitoring app isn’t just about displaying numbers – it’s a tool that helps you save money and take charge of your energy usage. For instance, the "Live Status" feature lets you see exactly how much power you’re pulling from the grid versus your solar panels when running energy-hungry appliances. Noticing grid imports during daylight hours? Try staggering tasks like doing the laundry or running the dishwasher to align with your solar production peaks. This live data doesn’t just help with daily adjustments; it plays a crucial role in shaping your broader savings strategy.
Many apps also feature an "Energy Independence" score, which shows the percentage of your energy needs met by your solar and battery system instead of the grid. It’s a handy way to track how self-sufficient your home is becoming.
If you’re on a time-of-use tariff, consider switching your app to "Savings" or "AI Optimisation" mode. This setting ensures your battery charges when electricity rates are low and discharges during costly peak periods. Got an electric vehicle? Schedule EV charging to match your solar production peaks, cutting down significantly on transport costs. These small tweaks can make a big difference to both your short-term efficiency and long-term savings.
Don’t forget to make use of weather-tracking tools like "Storm Guard." This feature can help you prepare for potential grid outages, keeping your system ready for anything. After storms or during high-pollen seasons, it’s also worth checking the "Array" or panel-level view in your app. This can help you spot debris or shading issues that might be affecting your system’s performance. Keeping your panels clean and your data up to date ensures you’re getting the best return from your EECO Energy system.
FAQs
How can I use the app to optimise my solar energy usage?
You can make the most of your solar energy with the EECO Energy app. This handy tool lets you track real-time data, plan energy-heavy tasks, and keep an eye on your system’s performance. By syncing your energy use with peak solar production, you can cut down on grid electricity and save money.
The app gives you live updates on energy generation, battery storage levels, and historical data. For instance, you can schedule appliances like your washing machine or EV charger to run during the sunniest parts of the day. Plus, it sends performance alerts so you can quickly address any issues and keep your solar system running smoothly.
With daily and monthly reports, you can spot patterns and tweak your energy habits to get the most out of your solar setup. This doesn’t just lower your electricity costs – it also helps reduce your carbon footprint, playing a part in a more sustainable future.
What should I do if my solar monitoring app shows unexpected data or inconsistencies?
Begin by reviewing the app’s system health or performance status to confirm that everything is operating as it should. Check the panel-level production data and cross-reference it with your own meter readings or any external monitoring devices you use.
If you still notice a mismatch, it might be caused by temporary connectivity problems, calibration inaccuracies, or a fault within the system. Reach out to the app’s support team for help. Make sure to have details ready, such as recent readings, timestamps, or any error messages shown in the app, to assist them in diagnosing the issue.
How can the app’s historical data help me decide when to upgrade my solar system?
Historical data offers a clear window into how your solar system has performed over time. By examining these trends, you can pinpoint periods when energy production might fall short, such as during the shorter daylight hours of winter.
If your system often runs at full capacity or falls behind in meeting your household’s energy needs, this data can guide you in deciding whether an upgrade is needed. Using these insights to plan an expansion can help you optimise energy efficiency and savings throughout the year.